Close to half this operation's power bill was demand charges. A deliberately small battery, sized against interval data rather than against the solar array, took a fifth off that line in the first year.
Full detail below.
Anonymized from a completed client proposal and installed system. Facility identity withheld. All figures below are the project's real modelled numbers on a FortisAlberta commercial demand-billed rate schedule.
The operation was consuming 432,810 kWh a year, which is substantial but unremarkable for the sector. What was unusual was the split. Of a $75,389 annual electricity cost, demand charges accounted for 43.7%. Energy usage made up 55.6%. Fixed charges came to under 1%.
That ratio is the whole story. Close to half the invoice was not being driven by how much electricity the site used. It was being driven by how fast it used it, in a handful of fifteen minute intervals across each month.
| Annual bill component | Before | Share |
|---|---|---|
| Energy charges | $41,899 | 55.6% |
| Demand charges | $32,958 | 43.7% |
| Fixed and other charges | $531 | 0.7% |
| Total annual electricity cost | $75,389 | 100% |
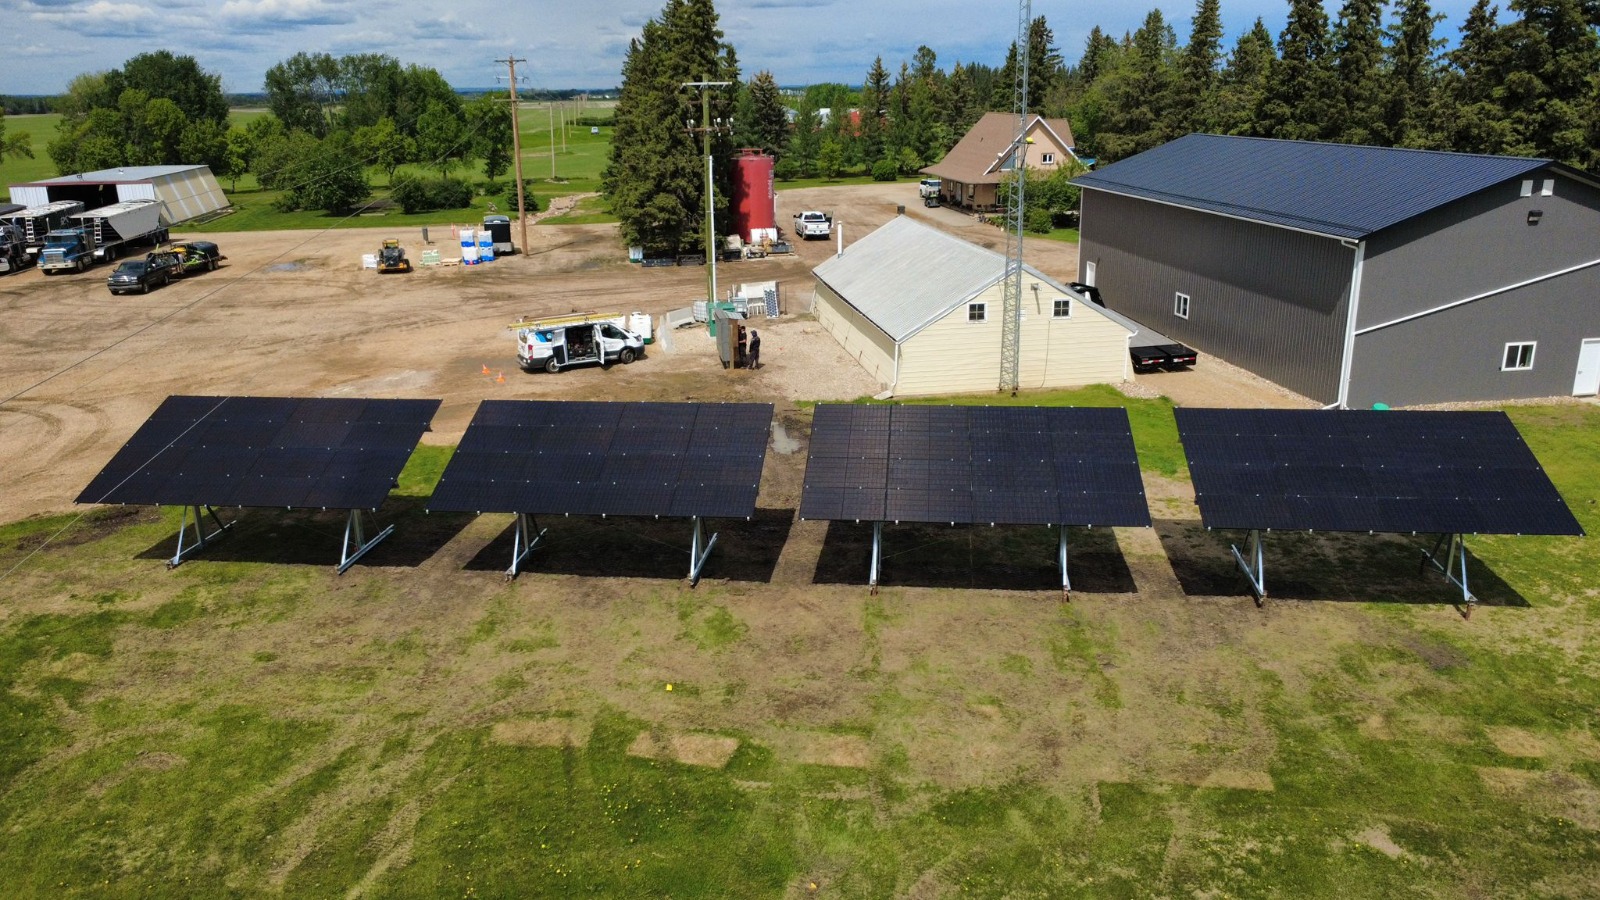
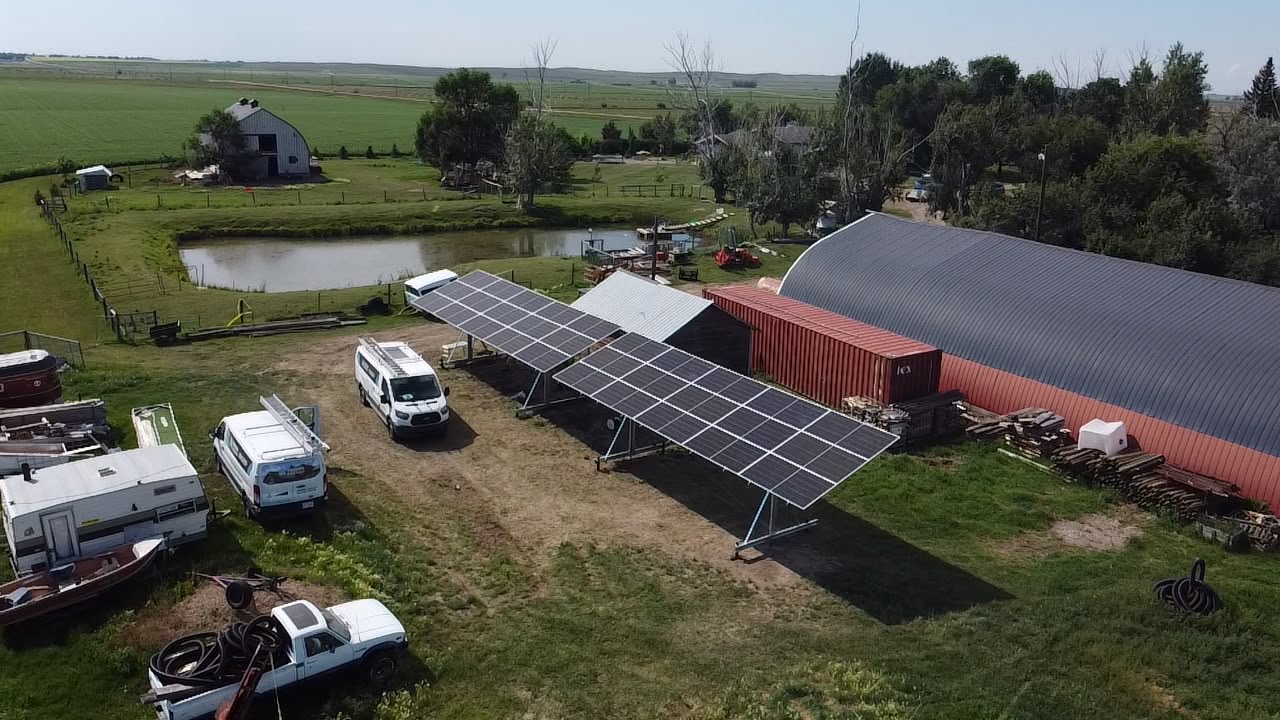
The system pairs a 150 kW solar array with a deliberately modest 15 kW / 30 kWh energy storage system. The size difference is the point, and it is the part most people get backwards.
Across the year the battery discharged 1,188 kWh, against 199,819 kWh of solar generation. That is well under one percent. This battery was never intended to shift bulk energy or to carry the site through outages. It was sized from interval data to cover the specific quarter hours that were setting billing demand, and nothing else.
The storage system delivered $6,639 in demand-charge savings over the year, taking the annual demand line from $32,958 down to $26,319. Total electricity cost fell from $75,389 to $49,784, an annual saving of $25,605 once the solar array's contribution to the energy charge is included.
| Before | After | Change | |
|---|---|---|---|
| Energy charges | $41,899 | $22,934 | -45% |
| Demand charges | $32,958 | $26,319 | -20% |
| Fixed and other | $531 | $531 | no change |
| Total annual cost | $75,389 | $49,784 | -34% |
The demand-charge reduction is attributable entirely to the storage system. The energy-charge reduction is attributable to the solar array. They are separate mechanisms hitting separate lines, which is exactly why they are worth modelling separately.
This is the clearest view of peak shaving as a mechanism. Very small amounts of stored energy, released at precisely the right moments, against the dollars they removed from the demand line.
| Month | ESS discharge (kWh) | Demand savings |
|---|---|---|
| Jan | 185 | $615 |
| Feb | 110 | $360 |
| Mar | 78 | $133 |
| Apr | 108 | $993 |
| May | 84 | $636 |
| Jun | 51 | $591 |
| Jul | 125 | $602 |
| Aug | 114 | $558 |
| Sep | 98 | $824 |
| Oct | 63 | $548 |
| Nov | 77 | $437 |
| Dec | 95 | $341 |
| Total | 1,188 | $6,639 |
Note the April figure: 108 kWh of discharge removed $993 from the bill, while January's larger 185 kWh discharge removed $615. Timing matters more than volume. A battery that fires during the interval that would have set the monthly peak is worth far more than one that discharges more energy at the wrong moment.
Summer peaks fell sharply. In one month metered demand dropped from 134 kW to 64 kW. Winter peaks barely moved, from 159 kW to 152 kW.
That is not a flaw in the dispatch logic, it is a straightforward consequence of duration. Summer peaks at this site were short bursts, exactly what 30 kWh of storage is built to absorb. Winter load was a sustained plateau lasting hours, and no battery of that size flattens a plateau. Anyone quoting you a peak shaving result should be able to tell you which of those two shapes your facility has, because it determines whether the numbers hold up.
It is also why the headline on this project is a 20% cut to the demand line rather than the 52% single-month figure. Both are true. Only one of them is the annual result.
The storage system is one component inside a larger capital project. Total project cost was $308,000, modelled as a cash purchase. Over a 25 year horizon the project returns $846,986 in electricity bill savings, against which the capital outlay leaves a cash total of $538,986.
Tax treatment adds materially to that. Federal depreciation of $400,200 and a $92,400 Clean Technology Investment Tax Credit, net of $60,030 of federal tax liability on the changed taxable income, produce a $152,430 improvement in federal tax position. Total 25 year cash flow comes to $691,416.
| 25-year cash purchase model | Amount |
|---|---|
| Project cost | -$308,000 |
| Electricity bill savings, 25 years | $846,986 |
| Cash total | $538,986 |
| Federal depreciation | $400,200 |
| Federal tax liability on changed taxable income | -$60,030 |
| Clean Technology Investment Tax Credit | $92,400 |
| Change in federal tax position | $152,430 |
| Total 25-year cash flow | $691,416 |
| Year 25 annual bill saving | $43,752 |
Modelled at a 5.0% discount rate, 15.0% federal and 8.0% provincial tax rates, 3.5% average annual utility escalation, 1,332 kWh/kW-DC of PV generation, 0.80% annual PV degradation and 5.00% annual ESS degradation. These are the assumptions behind the figures above, and changing any of them changes the result. Treat them as this project's inputs, not as a forecast for yours.
Net cost of the storage system after the federal Clean Technology ITC and CCA depreciation came to $3,770. Against $6,639 of annual demand savings, the battery's peak shaving value alone paid back its net cost in under a year, entirely separately from the solar array's economics.
Incentive treatment reflects the rates modelled at the time of this proposal. Current Clean Technology ITC and CCA rules should be confirmed against current federal guidance before applying them to a new project.
Demand charges accounted for 43.7% of the total annual electricity cost of $75,389, with energy usage making up 55.6% and fixed charges under 1%. Close to half the bill was being driven by the height of the site's peaks rather than by the amount of electricity it consumed.
The energy storage system delivered $6,639 in demand-charge savings across the year, reducing the annual demand line from $32,958 to $26,319, a cut of roughly 20%.
The storage system was 15 kW / 30 kWh, paired with a 150 kW solar array. The battery discharged 1,188 kWh over the year against 199,819 kWh of solar generation, which is well under one percent. It was not sized to shift bulk energy. It was sized to cover the specific intervals that were setting billing demand.
Net cost of the storage system after the federal Clean Technology ITC and CCA depreciation was $3,770. Against $6,639 of annual demand savings, the battery's peak shaving value alone paid back its net cost in under a year, separately from the solar array's contribution.
No, and this is the honest limit of the result. Summer peaks fell sharply, in one month from 134 kW to 64 kW. Winter peaks barely moved, from 159 kW down to 152 kW, because the winter load was sustained for far longer than a 30 kWh battery can cover. Storage flattens short spikes very effectively and long plateaus poorly.
